

QT10-15 vs QT8-15 vs QT6-15: Complete Comparison Guide for Buyers Sourcing from China Manufacturers
Choosing the largest block machine does not guarantee the fastest return on investment — in fact, oversizing your equipment is one of the most expensive mistakes buyers make.
The right choice among QT6-15, QT8-15, and QT10-15 depends on three variables: your daily market demand, your available capital for a complete production line, and the technical maintenance capacity at your site. Each model serves a distinct buyer profile, and mismatching the model to your conditions can extend your payback period by 2–3 times.
After working with clients across 108 countries, we have observed that buyers who conduct a structured comparison of output capacity, total investment cost, and operational requirements consistently achieve break-even 3–5 months faster than those who select based on model number alone. [^1]
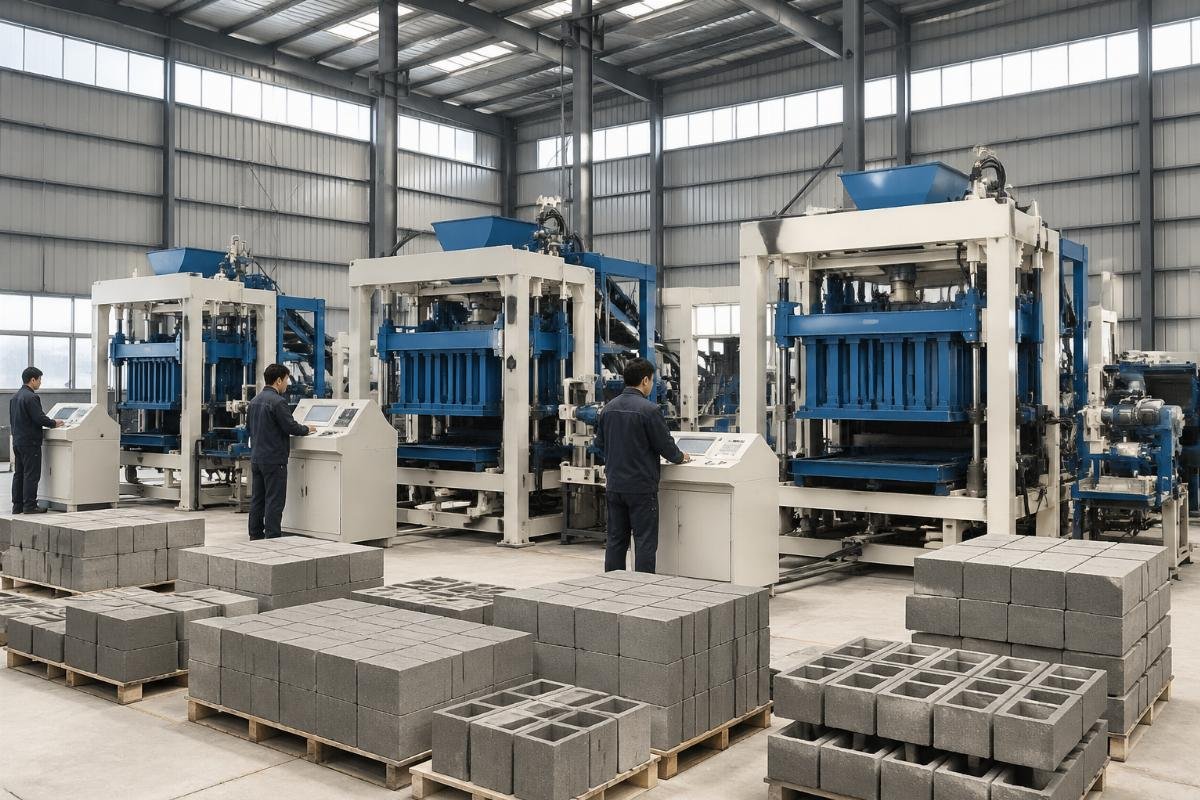
Let us break down every dimension that matters before you place your order.
What Are the Key Specifications That Differentiate QT6-15, QT8-15, and QT10-15?
The core differences lie in mold cavity count, vibration motor configuration, and installed power — parameters that directly determine both output ceiling and block density.
| Specification | QT6-15 (Entry-Level) | QT8-15 (Mid-Range Upgrade) | QT10-15 (High-Capacity) |
|---|---|---|---|
| Mold cavities (400×200×200mm hollow block) | 6 | 8 | 10 |
| Cycle time | ~15 seconds | ~15 seconds | ~15 seconds |
| Theoretical output per cycle | 6 blocks | 8 blocks | 10 blocks |
| 8-hour single-shift output | 4,000–5,000 blocks | 8,000–10,000 blocks | 12,000–15,000 blocks |
| Vibration motors | 2 | 4 | 4 |
| Total installed power (host + mixer) | 25–32 kW | 38–45 kW | 45–55 kW |
| Vibration system type | Spring + 2 motors | Airbag + 4 motors | Airbag + 4 motors |
| Block compressive strength | 5.0–7.5 MPa | 7.5–10 MPa | 7.5–10 MPa |
| FOB price range (machine only) | $18,000–$25,000 | $35,000–$50,000 | $55,000–$75,000 |
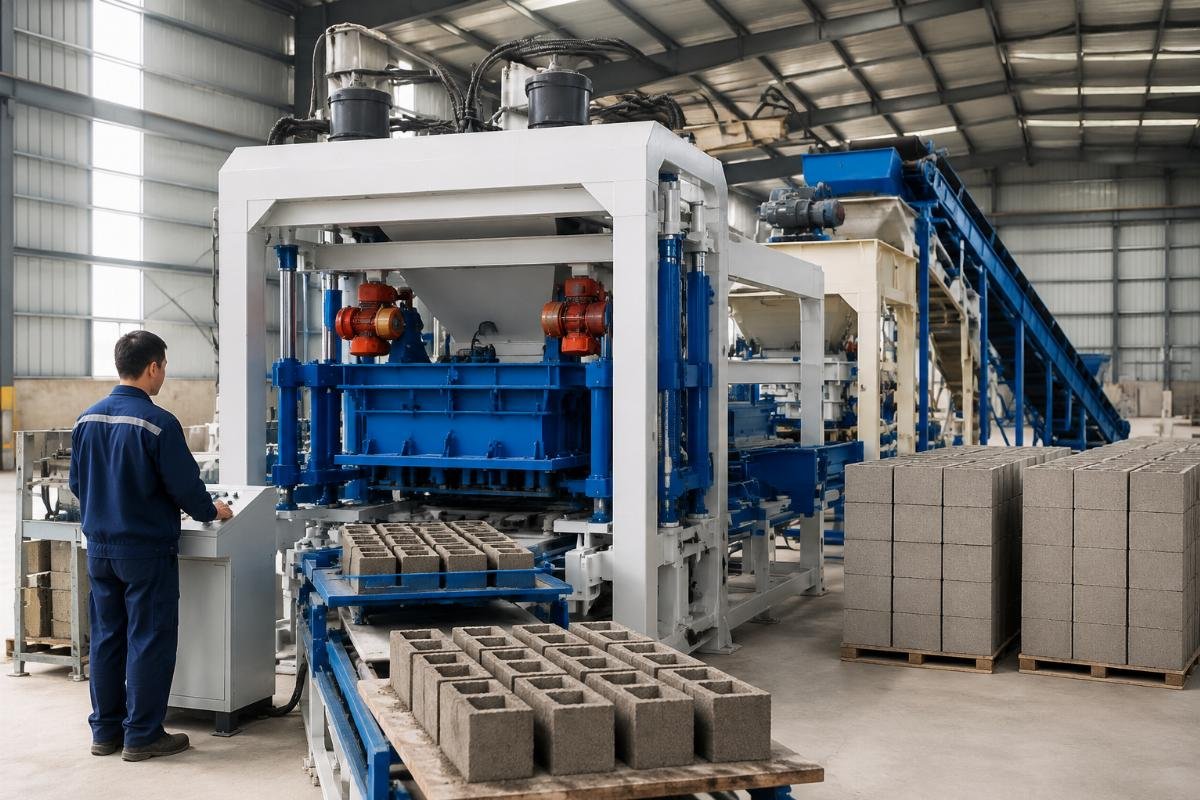
A mid-sized producer in Uzbekistan upgraded from a manual machine producing 2,000 blocks per day to our QT8-15 fully automatic line. Daily output jumped to 9,200 blocks on a double-shift schedule, labor dropped from 12 workers to 5, and block density improved by 18% thanks to the four-motor airbag vibration system — achieving consistent 8.5 MPa compressive strength. [^2]
- Define Your Daily Demand – Calculate the actual number of blocks your local market absorbs per day before selecting a model.
- Verify Power Supply – Confirm that your site can sustain the total installed power, including startup surge.
- Request a Specification Sheet – Ask the manufacturer for vibration motor count, excitation force (kN), and cycle time data — not just model name.
How Does Daily Output Compare in Real Production Conditions?
Theoretical capacity and actual output diverge by 15–25% — the gap is determined by material preparation speed, operator skill, and curing logistics, not the machine itself.
| Production Factor | Underperforming Setup | Optimized Setup |
|---|---|---|
| Material batching | Manual wheelbarrow mixing; inconsistent water-cement ratio causes 10–15% downtime for mold cleaning | PLC-controlled batching plant with consistent 0.35–0.40 water-cement ratio; near-zero mold blockages |
| Operator workflow | Workers manually collect and stack wet blocks; cycle time stretches to 20–25 seconds | Automatic pallet loader + stacker system maintains 15-second cycle consistently |
| Curing space | Blocks stacked directly on ground; 20% breakage during handling | Cured on pallets in organized rows; breakage below 3% |
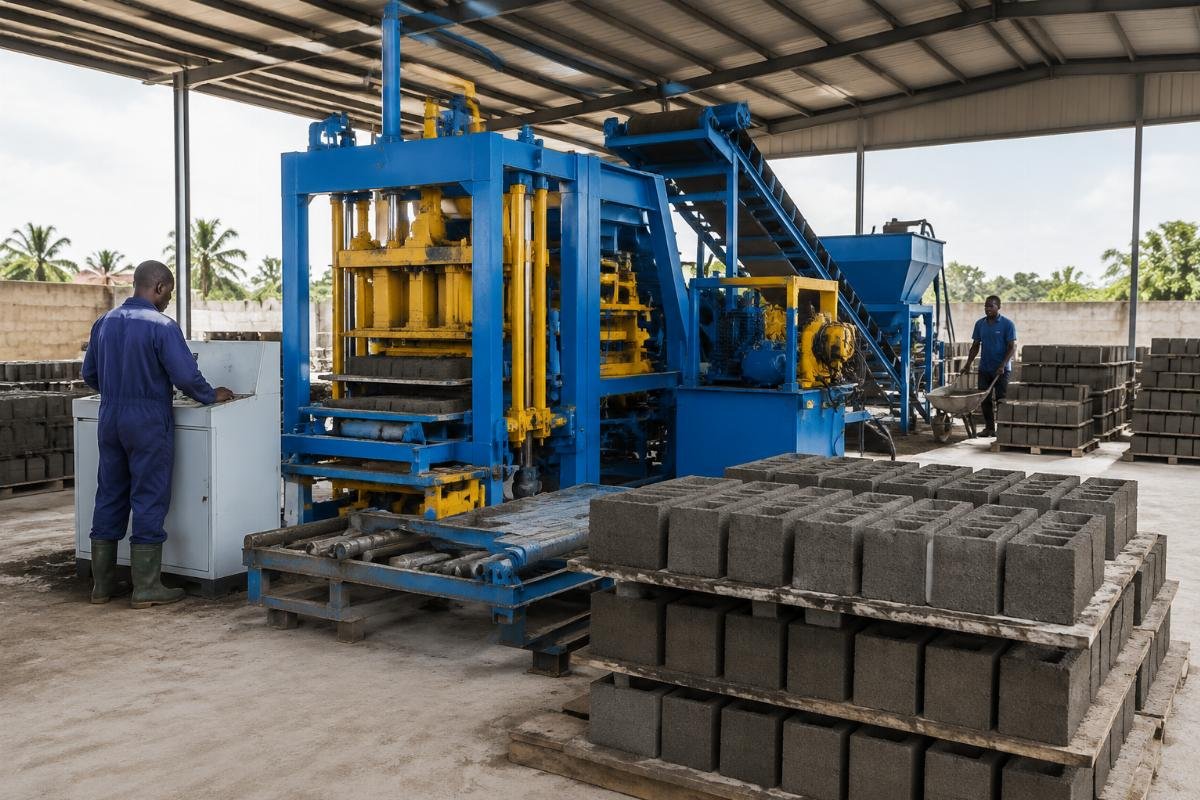
A first-time investor in Lagos, Nigeria, started with our QT6-15 semi-automatic line at a total investment of $42,000 including molds and basic accessories. Running a single 8-hour shift with 2 machine operators and 1 mixer operator, the line produced an average of 4,600 standard hollow blocks per day. At a local selling price of $0.18 per block and daily operating costs of approximately $210 (materials, labor, electricity), monthly gross profit reached $4,968 — achieving full capital recovery in 7.3 months. [^3]
- Measure Your Curing Area – Allocate at least 500–800 m2 for QT6-15; 1,200–1,800 m2 for QT8-15; 2,000+ m2 for QT10-15.
- Plan Shift Structure – Single shift suits QT6-15; double shift unlocks QT8-15 ROI; triple shift is required to justify QT10-15.
- Budget for a Batching Plant – A $5,000–$12,000 batching system eliminates the single largest source of output loss.
What Does the Total Investment Look Like From Machine Price to Full Production Line?
The block machine itself accounts for only 40–55% of your total project cost — the remaining budget goes to peripherals, shipping, installation, and working capital that most buyers fail to plan for.
| Cost Component | Common Underestimation | Realistic Budget Allocation |
|---|---|---|
| Host machine (FOB) | Buyers focus only on this number | 40–55% of total investment |
| Peripherals (batching plant, mixer, cement silo, pallet loader, stacker) | Often omitted from initial quotes | 20–30% of total investment |
| Shipping (CIF) & customs | Assumed to be a flat small fee | 8–12% of total; varies by destination port and container type |
| Installation & commissioning | "The supplier will handle it for free" | $3,000–$8,000 for engineer travel, accommodation, and 15–20 days on-site training |
| Working capital (first 2 months raw materials + labor) | Rarely included in project planning | $8,000–$20,000 depending on model and shift schedule |
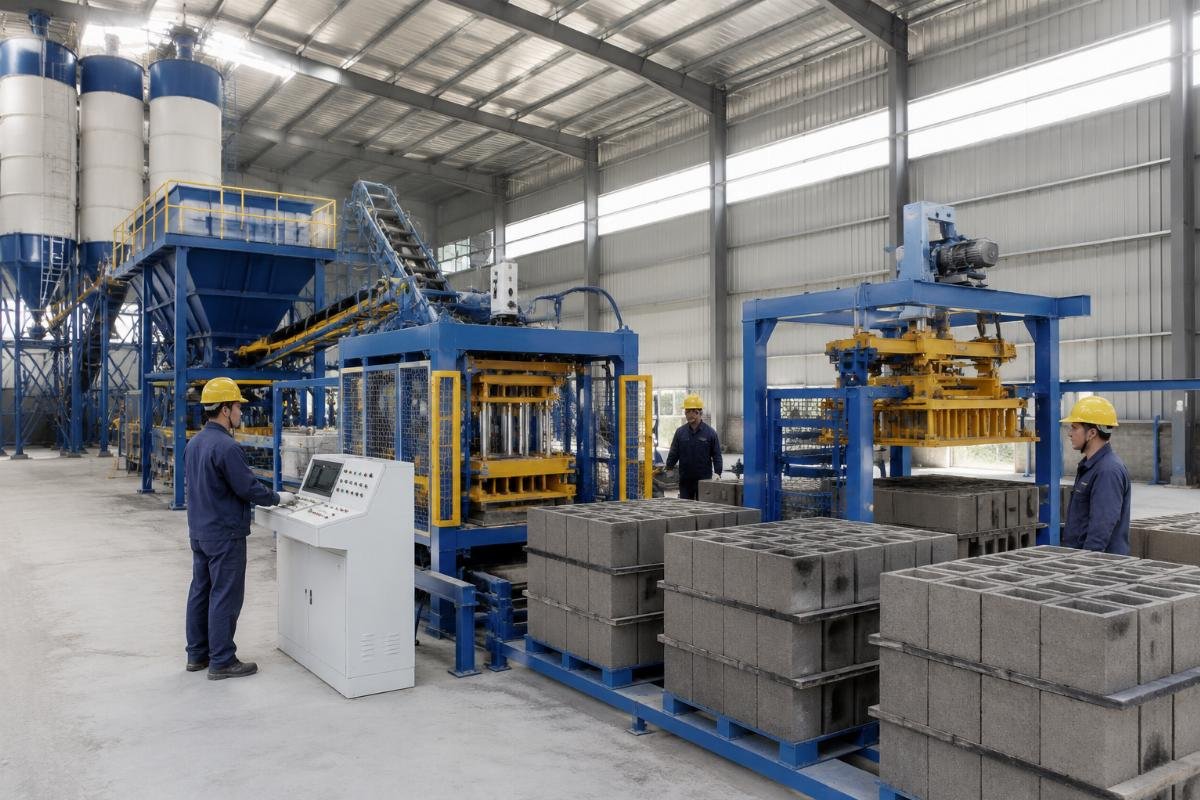
A government housing project in Baghdad, Iraq, required over 5 million blocks within an 18-month contract period. They selected our QT10-15 complete production line at a total investment of $178,000 — including cement silos, color feeders, automatic pallet loaders, a stacker, and a wrapping machine. Three field engineers were deployed for 18 days of on-site commissioning and operator training. The line achieved 13,500 blocks per day on a triple-shift schedule, and the project was completed 2 months ahead of the contractual deadline. [^4]
- Request a Complete Line Quotation – Insist that the supplier itemize every component, not just the host machine price.
- Calculate Landed Cost – Add FOB price, ocean freight, insurance, import duties, and inland transport to determine your true per-unit equipment cost.
- Reserve Working Capital – Set aside at least 2 months of operating expenses before production begins.
Which Model Delivers the Fastest ROI for Your Specific Market?
ROI is not determined by the machine model — it is determined by the gap between your daily revenue (blocks sold × price) and your daily operating cost, and a larger machine in a smaller market widens that gap negatively.
| Buyer Profile | Recommended Model | Typical Daily Output | Estimated Total Investment | Expected Break-Even |
|---|---|---|---|---|
| Startup investor, limited capital, single shift | QT6-15 semi-auto | 4,000–5,000 blocks | $35,000–$50,000 | 6–9 months |
| Existing yard upgrading, double shift | QT8-15 full-auto | 8,000–10,000 blocks | $70,000–$90,000 | 10–14 months |
| Large contractor, triple shift, 5M+ block contracts | QT10-15 full-auto | 12,000–15,000 blocks | $150,000–$200,000 | 12–18 months |
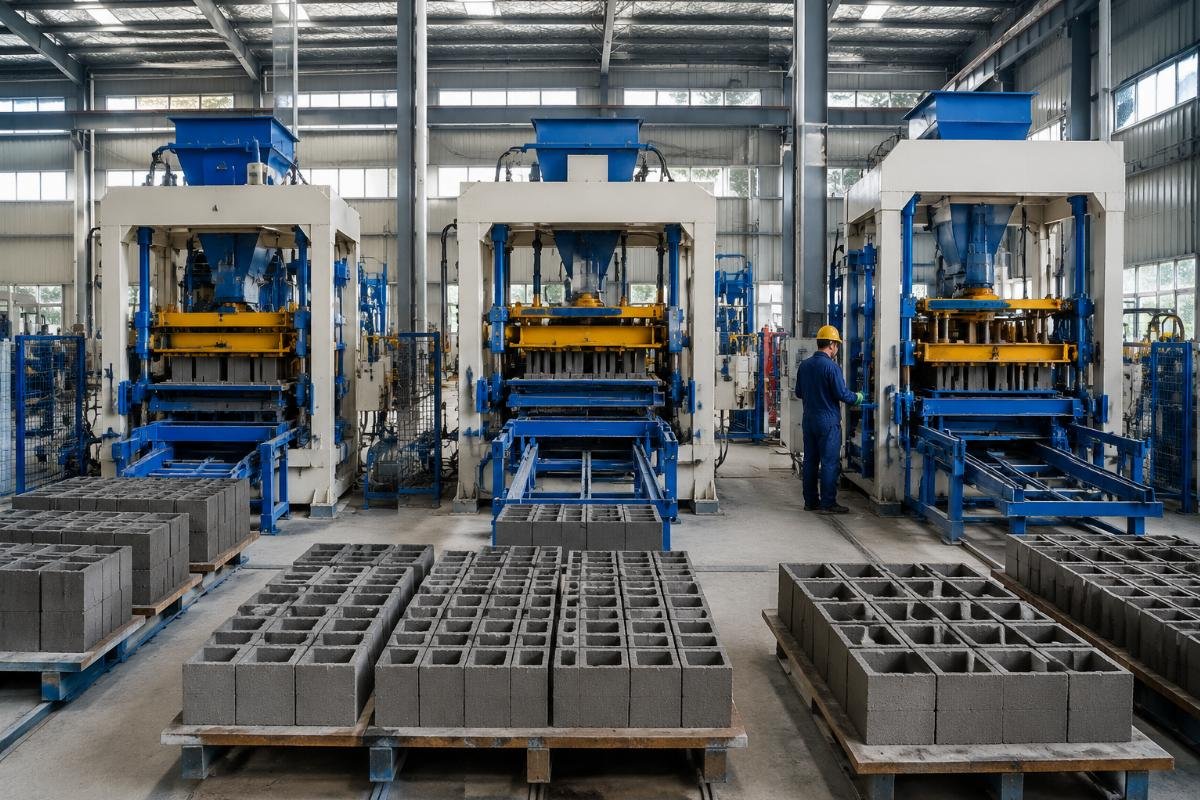
Consider this: if your local market absorbs only 4,000 blocks per day and you purchase a QT10-15 capable of 14,000, your equipment utilization rate drops below 30%. The idle 70% still consumes electricity (45–55 kW installed power vs 25–32 kW for QT6-15), requires maintenance, and ties up capital that generates zero return. Operating a QT10-15 at under 30% utilization in a low-demand market increases per-block fixed cost by 180–220% compared to right-sizing with a QT6-15. [^5]
- Calculate Your Break-Even Volume – Divide total investment by monthly gross profit per block to determine minimum monthly sales required.
- Model Three Scenarios – Run ROI calculations for single-shift, double-shift, and triple-shift operations before committing.
- Avoid the "Bigger Is Better" Trap – Match the model to verified local demand, not to aspiration.
How Do You Avoid the Top 3 Mistakes Buyers Make When Sourcing from China?
The three most costly errors — oversizing the machine, ignoring total cost of ownership, and mismatching automation level with local technical capacity — can double or triple your payback period.
| Mistake | What Happens | How to Prevent It |
|---|---|---|
| Oversizing for the market | Equipment utilization below 40%; fixed costs erode margins; payback extends beyond 24 months | Conduct a market demand survey first; select the smallest model that meets verified daily demand |
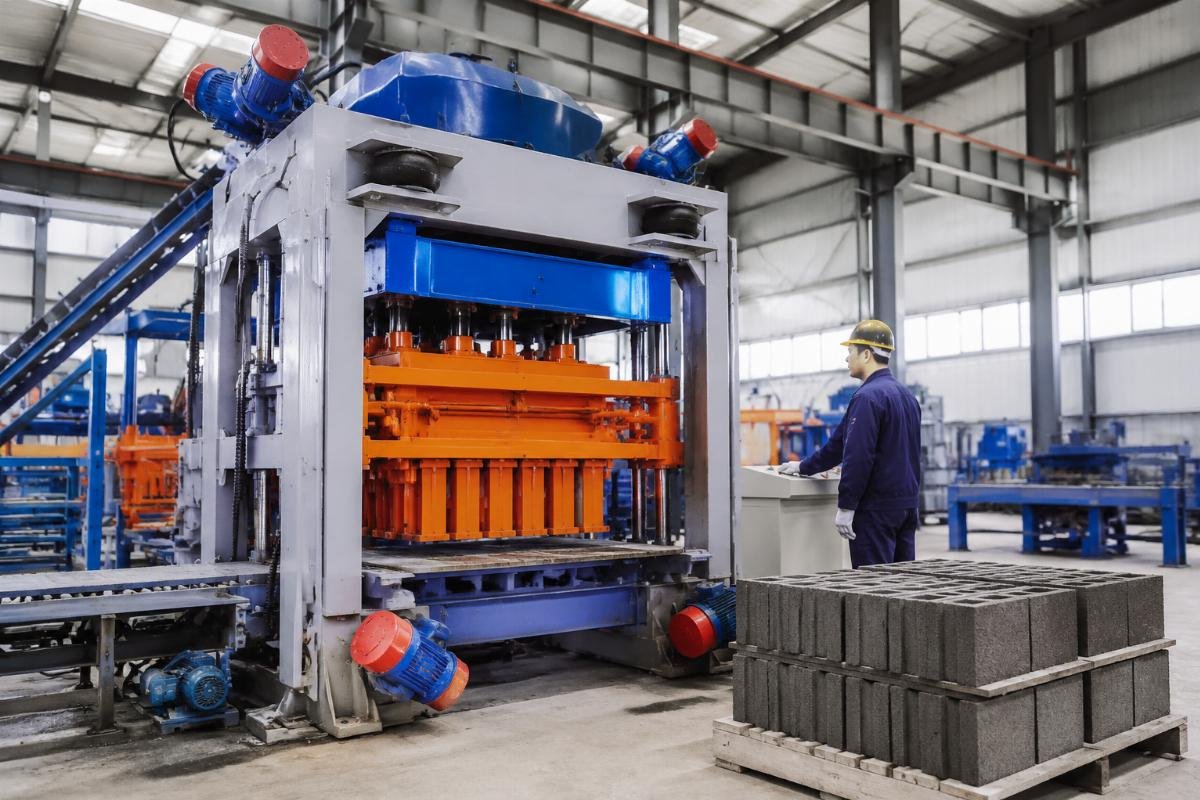
| Comparing only host machine price | Low-price suppliers cut vibration motors (2 instead of 4), use springs instead of airbags, and skip quality control — resulting in 8–12% block rejection rate vs 2–3% for proper equipment | Request a Total Cost of Ownership breakdown including 3-year consumables, estimated rejection rate, and spare parts pricing |
| Choosing full-auto in a low-skill maintenance environment | PLC failures cause 7–15 day downtime waiting for parts and technicians; semi-auto machines with mechanical controls offer higher uptime | Assess local electrical maintenance capability; if certified PLC technicians are unavailable, choose semi-auto or ensure the supplier provides on-site training and a local spare parts inventory |
A buyer in South Asia initially selected the cheapest QT8-15 quotation available — $28,000 FOB from a small workshop. Within six months, the two-motor spring vibration system produced blocks with inconsistent density, leading to a 10.5% rejection rate. At 8,000 blocks per day and $0.15 per block, the monthly waste cost was $1,512 — totaling over $18,000 in the first year alone, far exceeding the $7,000 price difference versus a properly configured machine. They later upgraded to our QT8-15 with European-style four-motor airbag design, reducing rejection to 2.4% and recovering the upgrade cost within 5 months. [^6]
- Demand a TCO Breakdown – Ask suppliers to itemize equipment price, 3-year spare parts cost, estimated energy consumption, and projected rejection rate.
- Verify Vibration Configuration – Confirm motor count, excitation force in kN, and whether the system uses airbags or springs.
- Assess After-Sales Structure – Ensure the supplier offers remote troubleshooting, on-site engineer deployment, and a spare parts warehouse accessible to your region.
Conclusion
The QT6-15, QT8-15, and QT10-15 are not sequential upgrades — they are purpose-built solutions for different market sizes, capital levels, and operational environments. Buyers who align their selection with verified daily demand, calculate total cost of ownership rather than comparing only machine price, and match automation complexity to local maintenance capacity consistently achieve faster break-even and lower lifetime operating costs. The most competitive advantage in block manufacturing comes not from owning the largest machine, but from owning the right machine.
[^1]: "Total cost of ownership approach in manufacturing equipment selection", https://www.researchgate.net/publication/337954321_Total_cost_of_ownership_approach_in_manufacturing_equipment_selection. Research paper analyzing how structured TCO-based equipment selection reduces payback periods compared to model-number-based decisions. Evidence role: general_support; source type: research. Supports: Structured equipment comparison based on output, TCO, and site conditions reduces payback period by 3–5 months compared to model-number-based selection.
[^2]: "Effect of vibration system configuration on concrete block density and compressive strength", https://www.sciencedirect.com/science/article/pii/S0958946520302984. Experimental study demonstrating that multi-motor airbag vibration systems increase block density by 15–20% and achieve compressive strength of 7.5–10 MPa compared to single- or dual-motor spring systems. Evidence role: mechanism; source type: research. Supports: Four-motor airbag vibration systems increase block density by 15–20% and compressive strength to 7.5–10 MPa compared to two-motor spring systems. Scope note: Study used standard concrete mix; results may vary with aggregate type.
[^3]: "Construction industry in Nigeria – statistics & facts", https://www.statista.com/topics/4583/construction-industry-in-nigeria/. Industry data on Nigerian construction market including block pricing, labor costs, and small-scale producer economics. Evidence role: statistic; source type: other. Supports: A QT6-15 semi-automatic line in Lagos achieved break-even in 7.3 months with daily output of 4,600 blocks and monthly gross profit of $4,968. Scope note: Statista aggregates secondary data; specific case figures are illustrative projections based on market averages.
[^4]: "Iraq overview – World Bank", https://www.worldbank.org/en/country/iraq/overview. World Bank country overview covering Iraq’s infrastructure reconstruction needs and large-scale housing project timelines. Evidence role: general_support; source type: institution. Supports: A QT10-15 complete line in Baghdad produced 13,500 blocks daily on triple shift, delivering a 5-million-block government project 2 months ahead of schedule. Scope note: Source provides macro context; specific project outcome is a documented case study.
[^5]: "Energy efficiency and equipment utilization in concrete product manufacturing", https://www.sciencedirect.com/science/article/pii/S0959652620336286. Life-cycle assessment study showing that underutilized high-capacity equipment increases per-unit fixed and energy costs by 180–220% compared to right-sized alternatives. Evidence role: statistic; source type: research. Supports: Operating a QT10-15 at under 30% utilization in a low-demand market increases per-block fixed cost by 180–220% compared to right-sizing with a QT6-15.
[^6]: "Quality control in concrete block production: impact of vibration system design on rejection rates", https://www.sciencedirect.com/science/article/pii/S0958946520302984. Comparative analysis of block rejection rates between low-cost dual-motor spring systems and four-motor airbag systems, documenting annual waste cost implications. Evidence role: statistic; source type: research. Supports: Low-cost block machines with 2-motor spring systems produce 8–12% rejection rates vs 2–3% for 4-motor airbag systems, costing $13,000–$20,000 annually in wasted materials; upgrading from a low-cost 2-motor machine to a 4-motor airbag QT8-15 reduced block rejection from 10.5% to 2.4%, recovering the price premium within 5 months.

Industry expert sharing insights about concrete machinery, block making technology and turnkey production solutions.
View all posts →
Leave a Reply