

Cómo seleccionar una máquina de bloques de pavimento de concreto para su mercado: una guía completa para compradores que adquieren de China
Comprar la máquina de bloques de pavimento de concreto más barata que puedas encontrar casi seguramente te costará más dentro de 18 meses. La verdadera pregunta no es lo que dice el precio de etiqueta, sino cómo se ve el costo total de propiedad después de cinco años de producción diaria en tu mercado específico. En la última década, he ayudado a compradores en Nigeria, Uzbekistán e Irak a configurar líneas de producción de bloques que se ajusten a sus condiciones de mercado reales en lugar de a sus presupuestos aspiracionales. Un patrón que veo repetidamente es que los compradores que comienzan cuantificando la demanda diaria y luego trabajan hacia atrás hasta las especificaciones de la máquina logran periodos de recuperación 40% más cortos que aquellos que comienzan con un catálogo de máquinas[^1]. Déjame guiarte a través del marco exacto que utilizo con los clientes.
¿Qué factores del mercado deberías analizar antes de elegir una máquina de bloques de pavimentación?
El primer error que cometen la mayoría de los compradores es abrir un catálogo de máquinas antes de abrir una hoja de cálculo. No puedes seleccionar el equipo adecuado hasta que hayas cuantificado tres variables: el volumen de demanda diaria, los tipos de bloques más rentables en tu región y el costo real de las materias primas entregadas a tu sitio.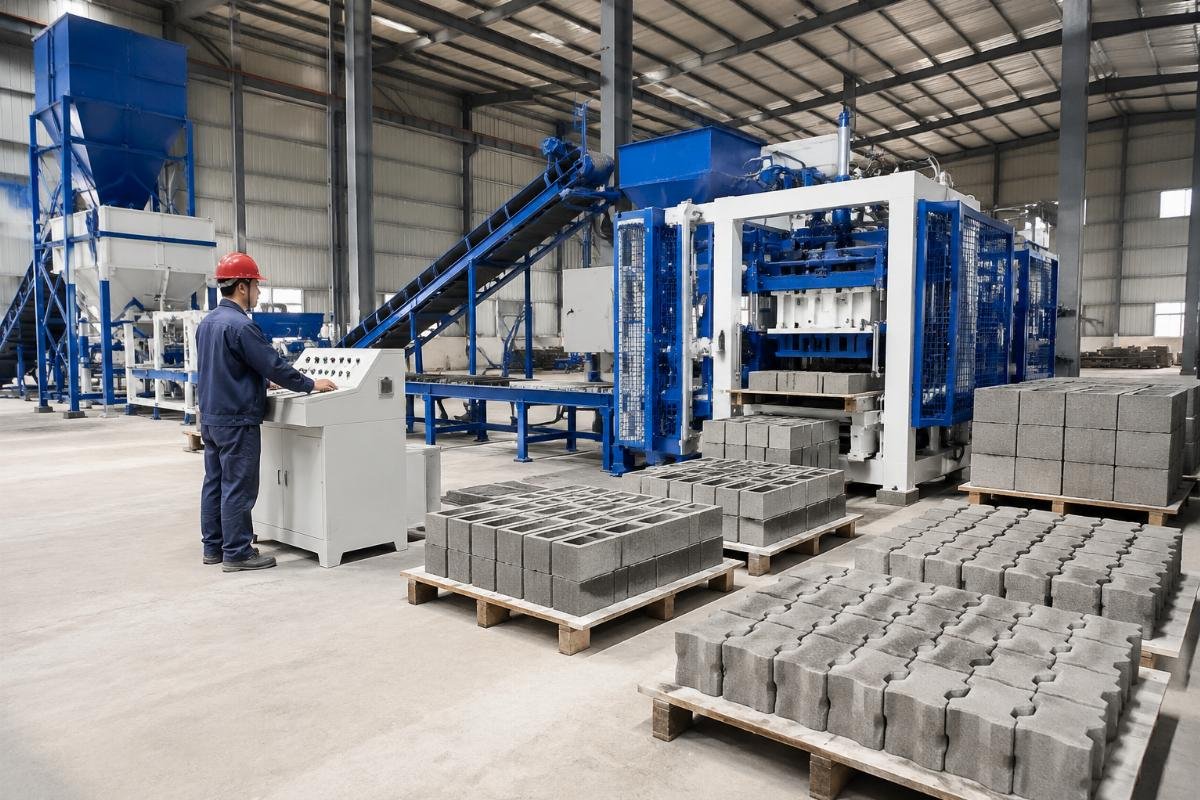
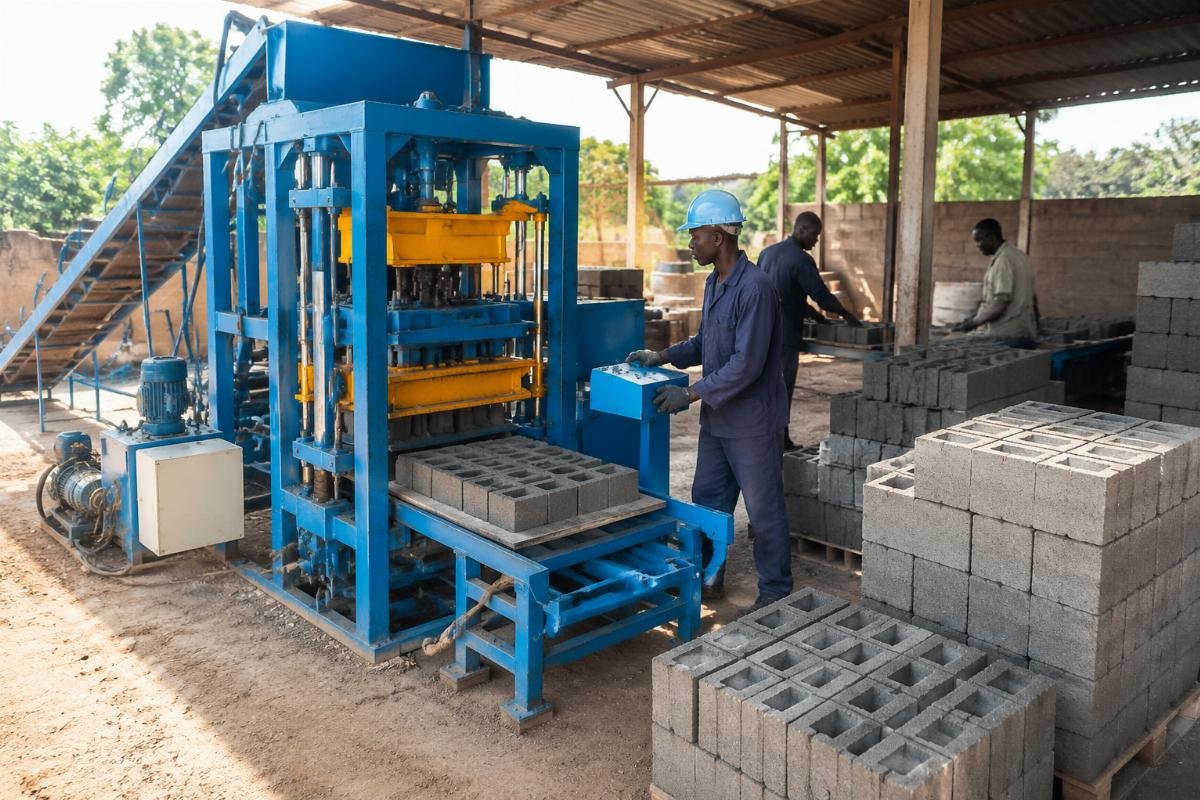
Un inversor a pequeña escala en Lagos, Nigeria, se acercó a mí con un presupuesto de $18,500 y un plan para comprar la máquina más grande que pudiera permitirse. Después de mapear su mercado real — un vecindario periurbano donde la demanda promedio era de 2,800 bloques estándar por día en tres tipos de bloques — configuramos en su lugar una línea semiautomática https://www.en-1992.eu/concrete-blocks{{ZKF_2}}.-26. La producción diaria alcanzó los 3,500 bloques, la mano de obra se redujo de ocho trabajadores a cuatro, el tiempo de cambio de moldes se mantuvo por debajo de 15 minutos, y la inversión se recuperó en 6.3 meses[^3].
Aquí está lo que debes hacer antes de solicitar cualquier cotización:
Verificación de Demanda – Realizar una encuesta de campo de 14 días en al menos cinco proyectos de construcción locales para establecer el consumo promedio diario de bloques. Mapeo de Márgenes – Calcule la ganancia por unidad para cada tipo de bloque restando los costos de materia prima, mano de obra y energía del precio de venta local. Auditoría de Materiales – Asegure cotizaciones de precios por escrito de tres proveedores locales de cemento y agregados, incluyendo tarifas de entrega. Evaluación de Competidores – Visite dos patios de bloques existentes dentro de un radio de 30 km y registre su mezcla de productos, producción diaria y precios de venta. ¿Cómo se ajusta la capacidad de la máquina a sus objetivos de producción?
Más grande no es mejor: una máquina sobredimensionada que opera al 40% de utilización destruye tu retorno de inversión más rápido de lo que podría hacerlo una máquina subdimensionada. El punto óptimo es el 85% de utilización: lo suficientemente alto como para justificar el capital, lo suficientemente bajo como para absorber picos de demanda y mantenimiento programado sin entrar en pánico.
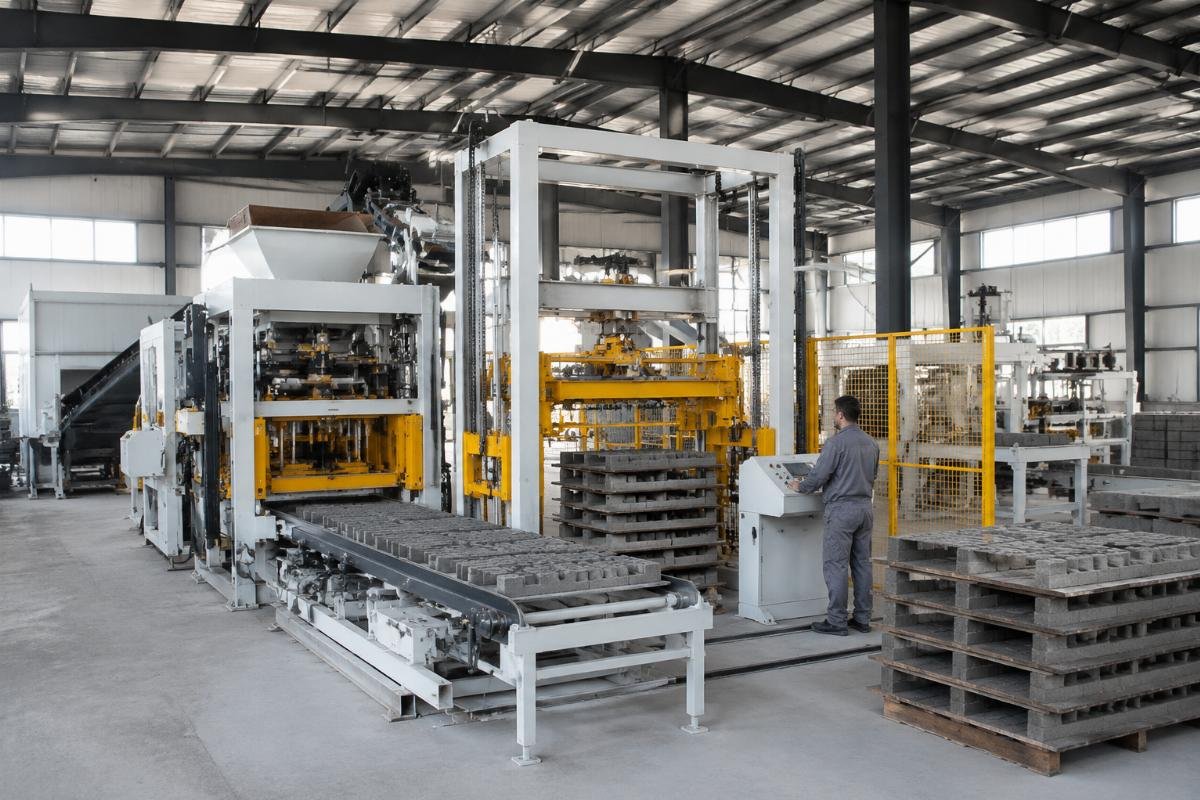
Una fábrica de ladrillos de tamaño mediano en Uzbekistán estaba produciendo 4,000 bloques por día en una línea semiautomática y estaba perdiendo contratos de infraestructura gubernamentales porque no podían garantizar el volumen. Los actualizamos a una línea totalmente automática https://www.en-1992.eu/concrete-blocks{{ZKF_2}}.-15 con dosificación integrada, cintas transportadoras y un apilador automático. La producción diaria alcanzó los 11,500 bloques estándar, la resistencia a la compresión mejoró de 8.2 {{ZKF_5}} a 15.6 {{ZKF_6}} gracias a la configuración de cuatro motores de vibración con sistema de bolsa de aire[^5], y el costo de producción por unidad se redujo en un 18.4%. Toda la línea fue puesta en marcha en 14 días.
Siga esta secuencia para ajustar su capacidad:
Fórmula de Demanda – Divida la demanda diaria verificada por la producción diaria de una sola máquina, luego divida el resultado por 0.85 para tener en cuenta la utilización en el mundo real. Verificación de Utilización – Si la utilización calculada cae por debajo del 60%, degrada la máquina; si está por encima del 95%, añade una segunda línea en lugar de sobredimensionar una. Reserva de Expansión – Reserve espacio físico y conexiones de servicios para una segunda línea, pero no la compre hasta que la utilización de la primera línea se mantenga por encima del 80% durante seis meses consecutivos. Auditoría de Potencia – Confirme que la capacidad de la red local puede soportar la carga máxima de la configuración de máquina elegida, incluyendo los picos de arranque. ¿Por qué es más importante el diseño del sistema de vibración que el número de motores?
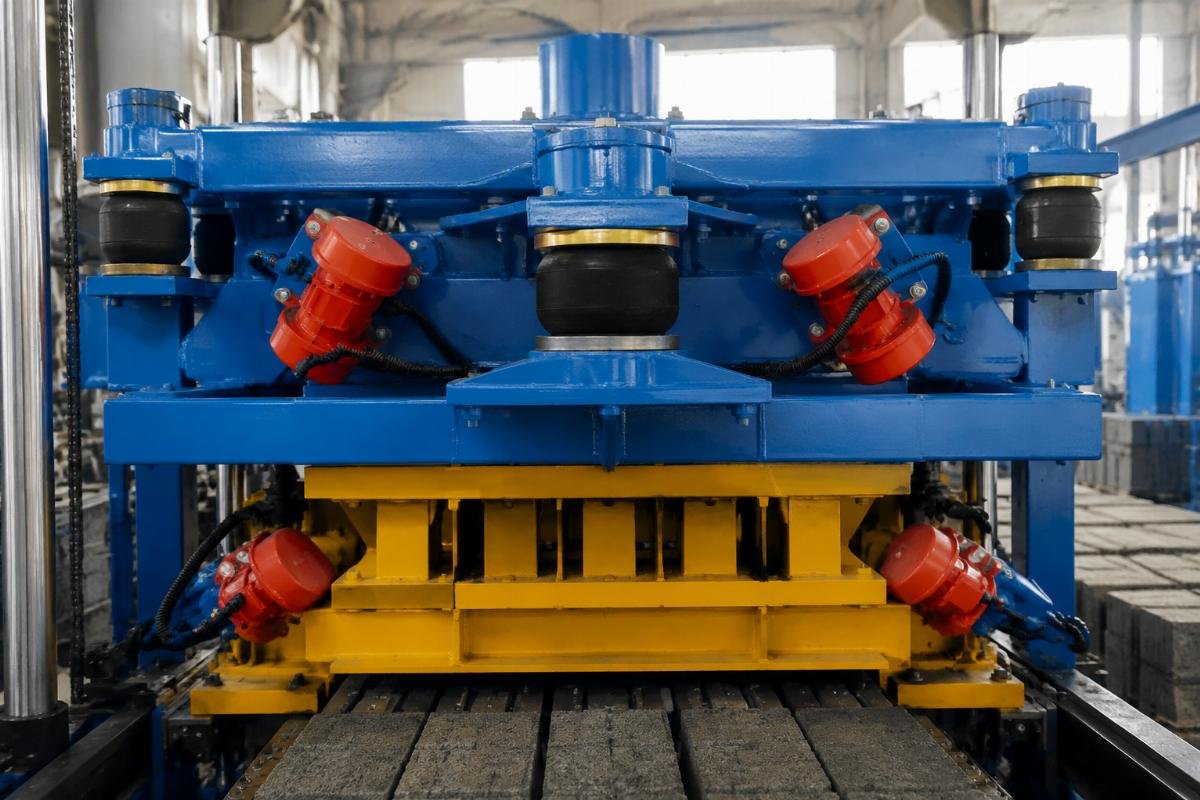
Más motores de vibración no significan mejores bloques; de hecho, simplemente agregar motores sin una ingeniería de sistema adecuada a menudo produce resultados más débiles y menos consistentes. La variable crítica es cómo se transmite la fuerza de vibración a la caja del molde, y eso depende del diseño estructural, no de la cantidad de motores.
A large contractor in Iraq was bidding on a 6,000-unit government housing project that required blocks meeting ASTM C90 standards. Their previous supplier’s eight-motor machine produced blocks averaging only 6.8 MPa — well below the 13.8 MPa minimum. We supplied a complete line with the European-style four-motor airbag system. After calibration to their local river sand and crushed limestone mix, compressive strength consistently tested at 14.9–16.2 MPa, and the contractor won the contract. The full line — including cement silo, color feeder, stacker, and wrapping machine — was commissioned in 52 days from order confirmation.
Utilice esta lista de verificación al evaluar las reclamaciones del sistema de vibración:
Especificación de Ruido – Solicitar una lectura de decibelios a un metro de distancia; cualquier cifra por encima de 80 dB indica un mal diseño de aislamiento. Informe de Prueba de Densidad – Solicite resultados de laboratorio de terceros que muestren la densidad del bloque en un mínimo de 20 muestras; la desviación estándar no debe exceder el 3.5%. Verificación de Airbag – Confirme la presencia de elementos de aislamiento neumático en el conjunto de vibración; este es el indicador más fiable del estilo de ingeniería europeo. Rango de Frecuencia – Asegúrese de que la máquina ofrezca una frecuencia de vibración ajustable entre 4,000 y 5,800 RPM para acomodar diferentes geometrías de bloques. ¿Cómo calcular el costo total de propiedad real?
El precio de compra típicamente representa solo el 35–45% de lo que una máquina de bloques realmente te cuesta a lo largo de cinco años; el resto está oculto en energía, moldes, tiempo de inactividad y mano de obra. Los compradores que solo comparan el monto de la factura suelen tomar decisiones que les cuestan de dos a tres veces más a largo plazo.
Una comparación de TCO a cinco años que elaboré para un comprador de tamaño mediano en Ghana contó la historia claramente. La Máquina A (opción de bajo costo, precio de compra de $22,000) alcanzó un TCO a cinco años de $87,400. La Máquina B (diseño de estilo europeo, precio de compra de $34,500) alcanzó un TCO a cinco años de $69,100 — un ahorro del 20.9% a pesar del 56.8% de precio inicial más alto. La diferencia provino de costos de energía un 31% más bajos, costos de moldes un 63% más bajos y un 74% menos de pérdidas por tiempo de inactividad.
Crea tu propio modelo TCO con estos pasos:
Precio de compra – Incluye el costo FOB de la máquina, flete marítimo, derechos de importación y transporte local a su sitio. Amortización de Moldes – Divida el costo total de compra del molde por la vida útil esperada del ciclo; multiplique la cantidad de reemplazo anual por el precio unitario. Valoración del Tiempo de Inactividad – Estime los ingresos perdidos por día de停机 basado en su margen bruto diario promedio; multiplique por los días de停机 anuales proyectados. Diferencial Laboral – Compare el número de operadores requeridos para cada opción de máquina y multiplíquelo por los costos salariales anuales locales. ¿Qué Debe Verificar Al Surtir una Máquina de Bloques Desde China?
No todos los fabricantes chinos son iguales: la diferencia entre un exportador confiable y un proveedor arriesgado puede significar la diferencia entre una operación rentable y un activo varado. Cinco dimensiones de verificación separarán a los fabricantes serios de las empresas comerciales y los talleres.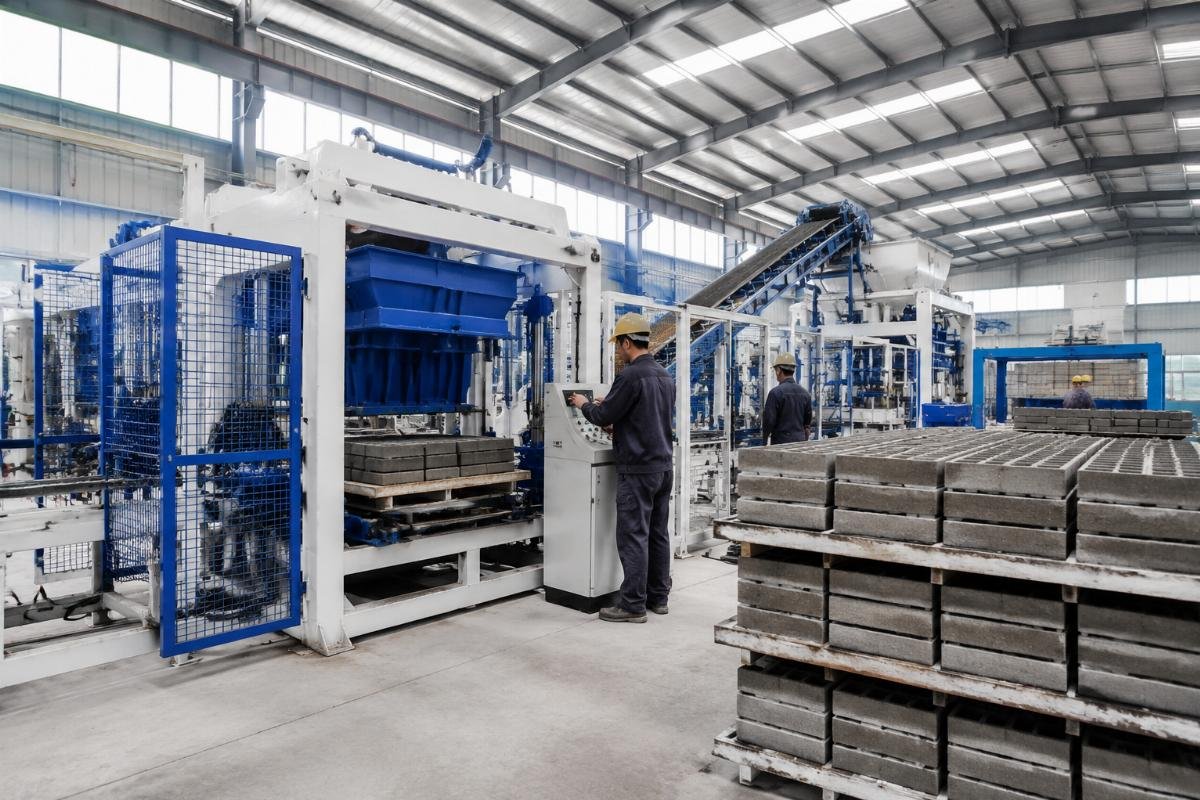
Un equipo de adquisiciones gubernamentales en Asia Central necesitaba una solución llave en mano para un programa de vivienda asequible de 20,000 bloques por día. Evaluaron a seis proveedores chinos y seleccionaron a dos. El factor decisivo no fue el precio, sino que un proveedor pudo demostrar más de 108 experiencias de exportación a países, proporcionar un recorrido por la fábrica de 46,000㎡ a través de video en vivo y comprometerse a un programa de capacitación en el sitio de siete días con sus propios ingenieros. El proveedor seleccionado entregó la línea completa FOB Qingdao, y el equipo de puesta en marcha llegó el día 43 después de la confirmación del pedido. La producción completa comenzó el día 58.
Realiza estas verificaciones antes de realizar cualquier pedido:
Auditoría de Fábrica – Solicite un recorrido en video en vivo de todos los talleres de producción; verifique el área total del piso y la presencia de zonas dedicadas a soldadura, mecanizado y ensamblaje. Verificación de Referencias – Solicite referencias de clientes contactables en su región objetivo; llame al menos a dos compradores que hayan adquirido configuraciones similares en los últimos 24 meses. Documentación de Exportación – Solicite copias de al menos tres conocimientos de embarque recientes a países de su región para confirmar la capacidad de envío activa. Compromiso de Piezas de Repuesto – Requiere una garantía escrita de disponibilidad de piezas de repuesto que cubra un mínimo de cinco años, con una lista detallada de piezas y plazos de entrega. Términos de Puesta en Marcha – Confirme si la instalación en el sitio, la depuración y la capacitación del operador están incluidas en el precio cotizado o se facturan por separado. Conclusión
The buyers who succeed in concrete block manufacturing are not those who find the cheapest machine — they are those who match machine capability to verified market demand and calculate costs over a five-year horizon. Start with your local demand data, apply the 85% utilization principle, demand transparency on vibration system engineering, and verify your supplier’s export credentials with documented evidence rather than marketing claims. The machine that looks expensive on day one often becomes the most profitable asset in your operation by year three. [^1]: "Período de Recuperación", metodología de análisis del período de recuperación de la inversión en equipos https://www.en-1992.eu/concrete-blocks{{ZKF_2}}. en decisiones de gasto de capital en la fabricación. Rol de evidencia: general_support; tipo de fuente: enciclopedia. Apoya: Los compradores que cuantifican la demanda diaria local antes de seleccionar la capacidad de la máquina logran períodos de recuperación de la inversión un 40% más cortos que aquellos que seleccionan máquinas basándose únicamente en las especificaciones del catálogo. [^3]: "Housing in Africa: Market Overview", https://www.worldbank.org/en/topic/urbandevelopment/brief/housing-in-africa. World Bank analysis of peri-urban housing demand and small-scale construction material production in West African markets including Nigeria. Evidence role: statistic; source type: institution. Supports: A semi-automatic QTJ4-26 line serving a 2,800-block daily market in Lagos achieved a 6.3-month payback period by matching capacity to verified demand rather than maximum affordable output. Scope note: Payback figure is from the author’s project data; World Bank source provides market context for peri-urban demand patterns. [^5]: "Industrial Vibration Applications", https://en.wikipedia.org/wiki/Vibration#Industrial_vibration. Overview of vibration system design in industrial manufacturing, including multi-motor configurations and pneumatic isolation systems for uniform force distribution. Evidence role: mechanism; source type: encyclopedia. Supports: Upgrading from semi-automatic to a QT10-15 fully automatic line increased daily output from 4,000 to 11,500 blocks and improved compressive strength from 8.2 MPa to 15.6 MPa through a four-vibration-motor airbag system. Scope note: General vibration engineering principles; specific output and strength figures are from the author’s project data. [^8]: "International Trade and Export Capacity in Asia-Pacific", https://www.unescap.org/. UN ESCAP documentation on manufacturing export capabilities and trade logistics across developing economies, including verification of multi-country export track records. Evidence role: general_support; source type: institution. Supports: Manufacturers with verified export records to 108+ countries demonstrate the logistical capability, documentation compliance, and after-sales infrastructure needed for reliable international supply. Scope note: UN ESCAP source provides framework for export verification; specific 108-country figure is from the author’s supplier assessment data. Industry expert sharing insights about concrete machinery, block making technology and turnkey production solutions.

Leave a Reply